|
|
Legend Setup
Legend
The legend is the area to the right of the plot in the View/Print window that gives
the list of
signals in the plot, and which line corresponds to which signal.
Choose the 'Legend...' option from the 'Annotate' menu of the
View/Print window to
display the following dialog box:
To apply your chosen legend option without closing the dialog click
'Apply'. To
apply and close the box, click 'Exit'. Clicking 'Cancel' will
remove any changes
that were applied since the dialog box has been open.
The actual contents of the legend entry for an individual signal are
held in its style.
Since September 2009 it has been possible to have a legend that
dynamically changes
according with the content of the plot. In the legend text area it is
possible to specify a parameter, for example %MAX%, that will be
interpreted by Jetdsp and substituted in the legend. It is also
possible to copy and paste the legend over multiple subplots using
"Copy" and "Paste" buttons.
Available pre-defined commands are:
- %PULSE% - prints the pulse of the signal
- %MEAS% - prints the DDA/DTYPE of the signal
- %NPTS% - the number of samples of the signal
- %APTS% - the number of samples of the signal actually plotted on
the graph
- %MAX% - the max value
- %TMAX% - the time of the max value
- %MIN% - the minimum value
- %TMIN% - the time of the minimun value
- %SUM% - the algebric sum of the values of the samples actually
plotted on the graph
- %NL% - insert a new line in the legend
- %STD% - create a standard legend. This parameter is useful in
addition to those above. Note that everything after this parameter
will be stored in a different line.
Note that the parameters specified above are case sensitive.
It is also possible to extend this set of parameters using a customized
function stored in the ~/.jetdsp/Addins folder. The function must to be
specified in the legend text between "?".
It is important that:
- the function must return a single line string
- it is possible to pass to the function data value using "x" and
"y" keywords
Examples:
1) Print the max and min value of a signal and their time. Set the
legend text to "%MAX% - %TMAX% %NL% %MIN% - %TMIN%" as
shown in the figure
This will produce the following plot:
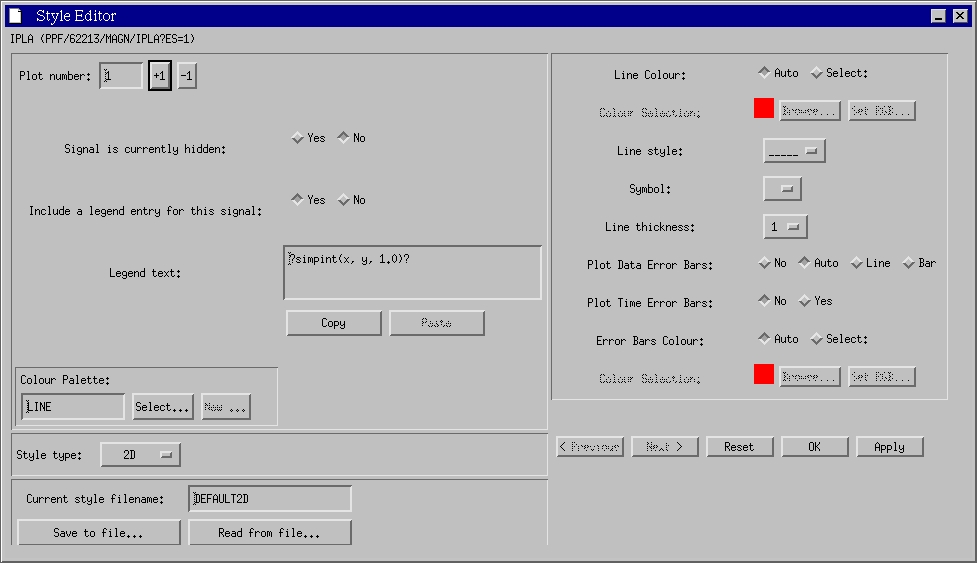
2) Define a cutomized function "simpInt" that accept as input the
value of the signal plotted and calculates a simple integral. In the
~/.jetdsp/Addins/ folder define a function simpInt as follow:
function simpint, x, y, alpha
ret = ''
d=y[0]/x[0]
for ii=1,N_ELEMENTS(x)-1 do begin
d=d+alpha*(y[ii]-y[ii-1])/(x[ii]-x[ii-1])
endfor
ret=STRTRIM(STRING(d),2)
return, ret
end
Set the legend equal to ?simpint(x, y,
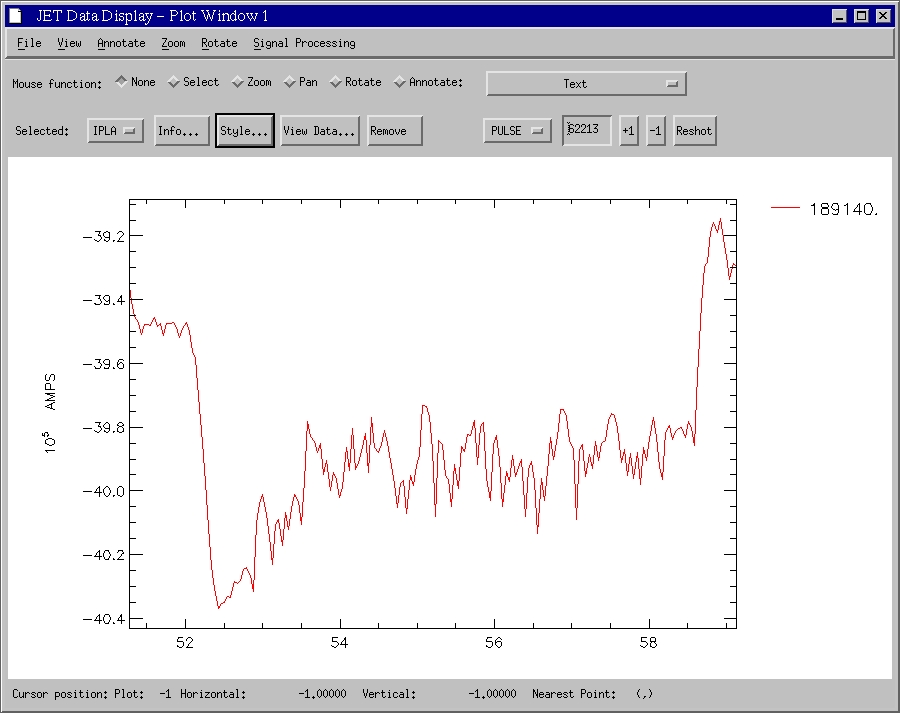
1.0)? as shown in figure:
This will produce the following plot:
|
 JETDSP for IDL Online Manual